Wilson Financial Services Inc.

(859) 824-9422

Investment

Bull & Bear Markets: A Timeline

Bull & Bear Markets: A Timeline. Before 2020, the financial sector enjoyed one of the longest bull markets in history. Beginning in March 2009, the covid 19 pandemic ended this run in March 2020. However, recovery was swift, and a new bull market started in April that same year. As we face an uncertain road ahead, let's take a look at history's most recent bull and bear markets, as outlined by the S&P 500. Sources 1 and 2. Investing involves risks, and investment decisions should be based on your own goals, time horizon and tolerance for risk. The S&P 500 is an unmanaged index that is generally considered representative of the U.S. stock market. Index performance is not indicative of the past performance of a particular investment. Past performance does not guarantee future results. Individuals cannot invest directly in an index.Bull & Bear Markets: A Timeline. Before 2020, the financial sector enjoyed one of the longest bull markets in history. Beginning in March 2009, the covid 19 pandemic ended this run in March 2020. However, recovery was swift, and a new bull market started in April that same year. As we face an uncertain road ahead, let's take a look at history's most recent bull and bear markets, as outlined by the S&P 500. Sources 1 and 2. Investing involves risks, and investment decisions should be based on your own goals, time horizon and tolerance for risk. The S&P 500 is an unmanaged index that is generally considered representative of the U.S. stock market. Index performance is not indicative of the past performance of a particular investment. Past performance does not guarantee future results. Individuals cannot invest directly in an index.Bull Market: An extended period in time in which stocks rise in value. Bear Market: Marked by a 20% (or more) drop in the price of securities from the most recent high. The average Bull market lasted 52.8 months and returned 152.6 percent. The average Bear market lasted only 11.3 months and lost 32.1 percent.Bull Market: An extended period in time in which stocks rise in value. Bear Market: Marked by a 20% (or more) drop in the price of securities from the most recent high. The average Bull market lasted 52.8 months and returned 152.6 percent. The average Bear market lasted only 11.3 months and lost 32.1 percent.Bull & Bear Market Trends For the Last 50 Years. Starting in 1970, there was a 73.5 percent increase over the course of 2.6 years. Starting in 1973, there was a 48.2 percent decrease over the course of 1.7 years.Bull & Bear Market Trends For the Last 50 Years. Starting in 1970, there was a 73.5 percent increase over the course of 2.6 years. Starting in 1973, there was a 48.2 percent decrease over the course of 1.7 years.Starting in 1974, there was a 125.6 percent increase over the course of 6.2 years. Starting in 1980, there was a 27.1 percent decrease over the course of 1.7 years.Starting in 1974, there was a 125.6 percent increase over the course of 6.2 years. Starting in 1980, there was a 27.1 percent decrease over the course of 1.7 years.Starting in 1982, there was a 228.8 percent increase over the course of 5 years. Starting in 1987, there was a 33.5 percent decrease over the course of .3 years.Starting in 1982, there was a 228.8 percent increase over the course of 5 years. Starting in 1987, there was a 33.5 percent decrease over the course of .3 years.Starting in 1987, there was a 582.1 percent increase over the course of 12.3 years. Starting in 2000, there was a 36.8 percent decrease over the course of 1.5 years. Starting in 2001, there was a 21.4 percent increase over the course of .3 years. Later that same year, there was a 33.8 percent decrease over the course of .8 years.Starting in 1987, there was a 582.1 percent increase over the course of 12.3 years. Starting in 2000, there was a 36.8 percent decrease over the course of 1.5 years. Starting in 2001, there was a 21.4 percent increase over the course of .3 years. Later that same year, there was a 33.8 percent decrease over the course of .8 years.Starting in 2002, there was a 101.5 percent increase over the course of 5 years. Starting in 2007, there was a 51.9 percent decrease over the course of 1.1 years. Starting in 2008, there was a 24.2 percent increase over the course of .1 years. Later that same year, there was a 27.6 percent decrease over the course of 1 year.Starting in 2002, there was a 101.5 percent increase over the course of 5 years. Starting in 2007, there was a 51.9 percent decrease over the course of 1.1 years. Starting in 2008, there was a 24.2 percent increase over the course of .1 years. Later that same year, there was a 27.6 percent decrease over the course of 1 year.Starting in 2009, there was a 400.5 percent increase over the course of 11 years. Starting in 2020, there was a 33.9 percent decrease over the course of .1 years. There’s been an ongoing increase since 2020.Starting in 2009, there was a 400.5 percent increase over the course of 11 years. Starting in 2020, there was a 33.9 percent decrease over the course of .1 years. There’s been an ongoing increase since 2020.Source 1: CaptiveInternational.com, 2021. Source 2: Yardeni.com, 2022. The content is developed from sources believed to be providing accurate information. The information in this material is not intended as tax or legal advice. It may not be used for the purpose of avoiding any federal tax penalties. Please consult legal or tax professionals for specific information regarding your individual situation. This material was developed and produced by FMG Suite to provide information on a topic that may be of interest. FMG, LLC, is not affiliated with the named broker-dealer, state- or SEC-registered investment advisory firm. The opinions expressed and material provided are for general information, and should not be considered a solicitation for the purchase or sale of any security.Source 1: CaptiveInternational.com, 2021. Source 2: Yardeni.com, 2022. The content is developed from sources believed to be providing accurate information. The information in this material is not intended as tax or legal advice. It may not be used for the purpose of avoiding any federal tax penalties. Please consult legal or tax professionals for specific information regarding your individual situation. This material was developed and produced by FMG Suite to provide information on a topic that may be of interest. FMG, LLC, is not affiliated with the named broker-dealer, state- or SEC-registered investment advisory firm. The opinions expressed and material provided are for general information, and should not be considered a solicitation for the purchase or sale of any security.
 

Related Content

The Sequence of Returns

The Sequence of Returns

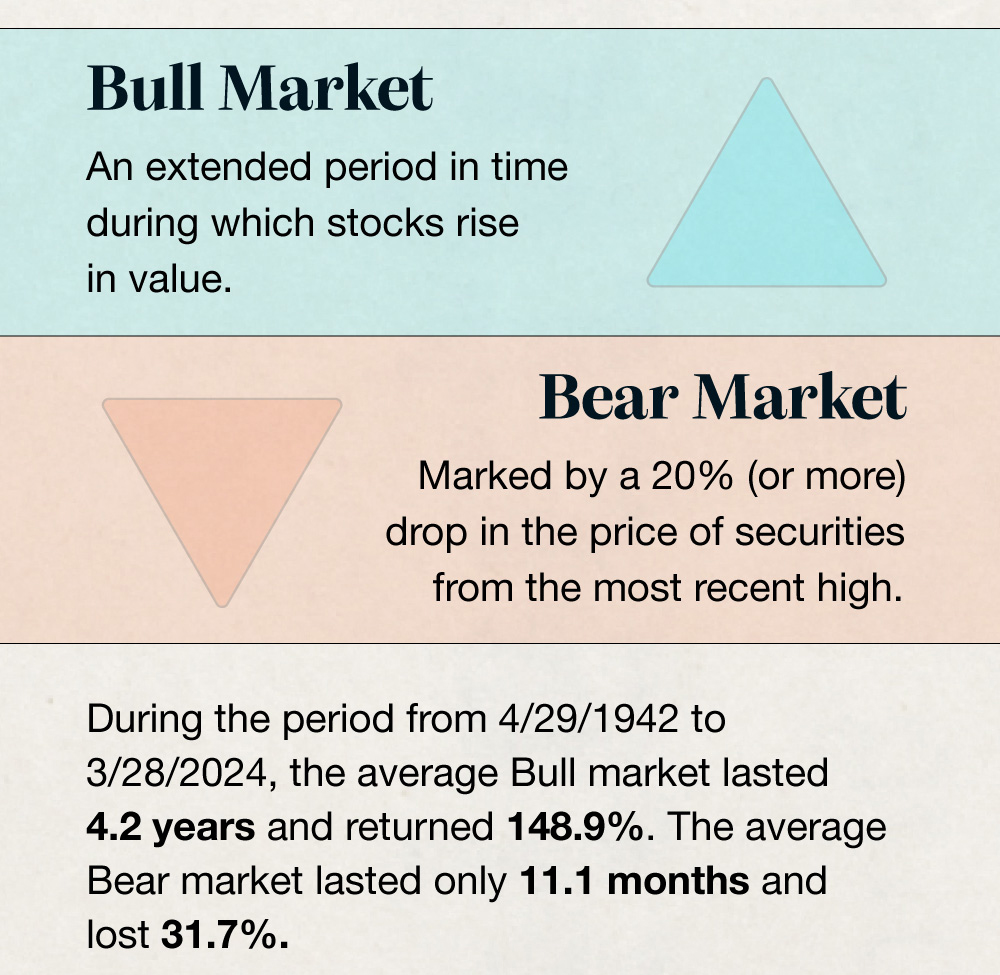
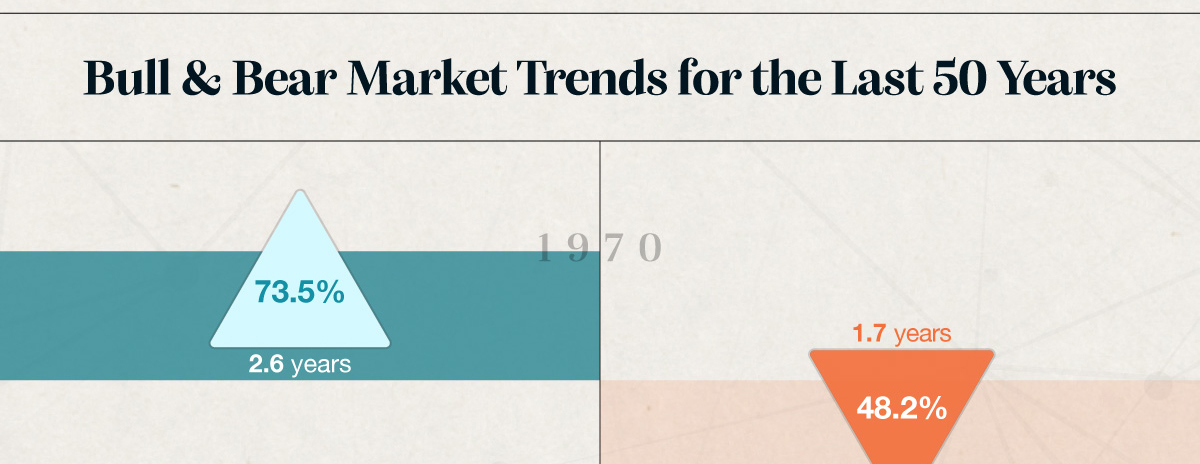
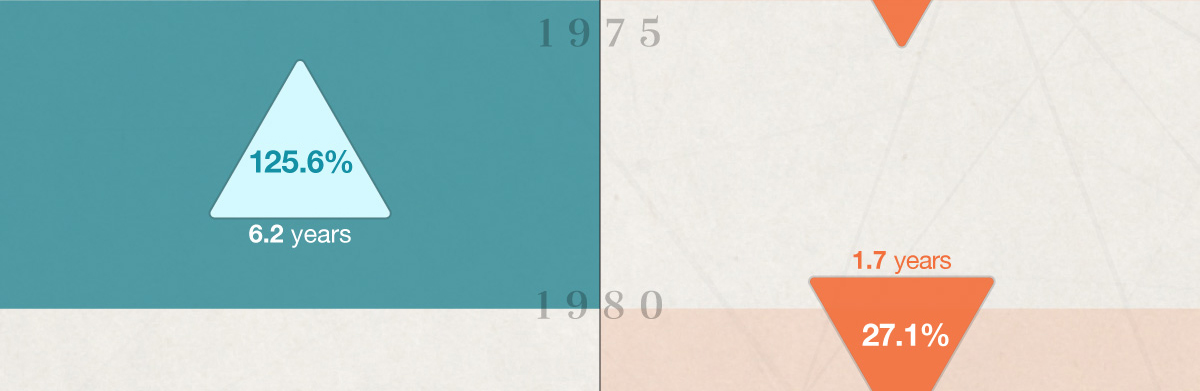
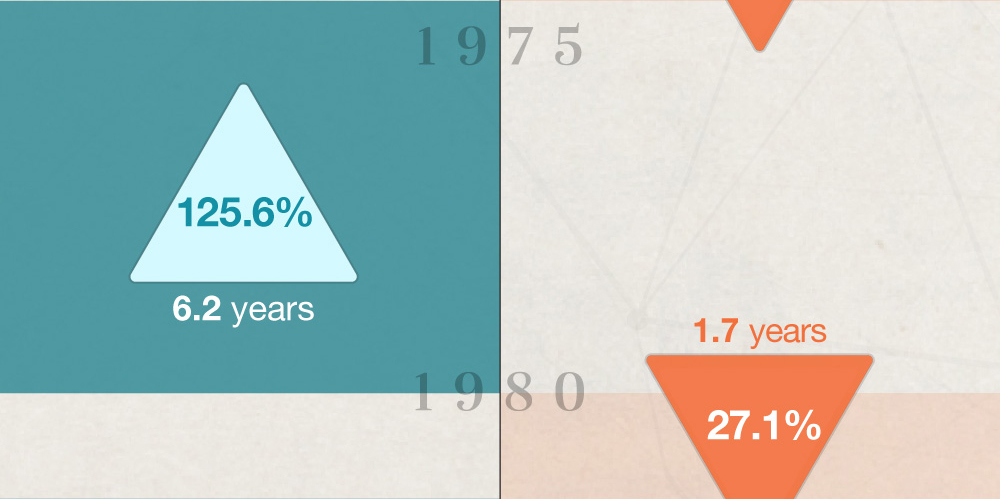
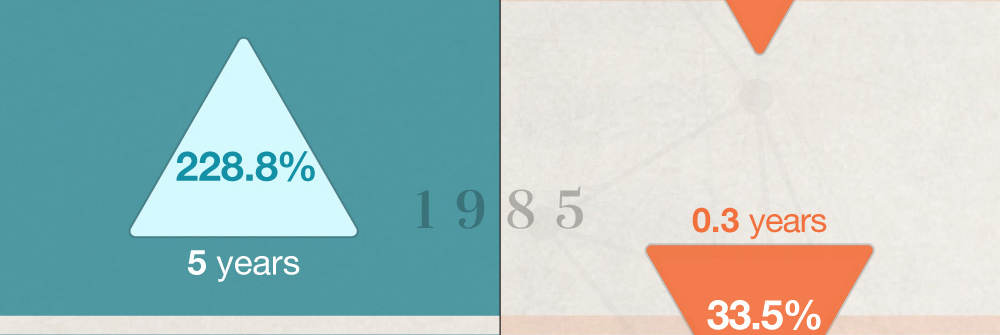
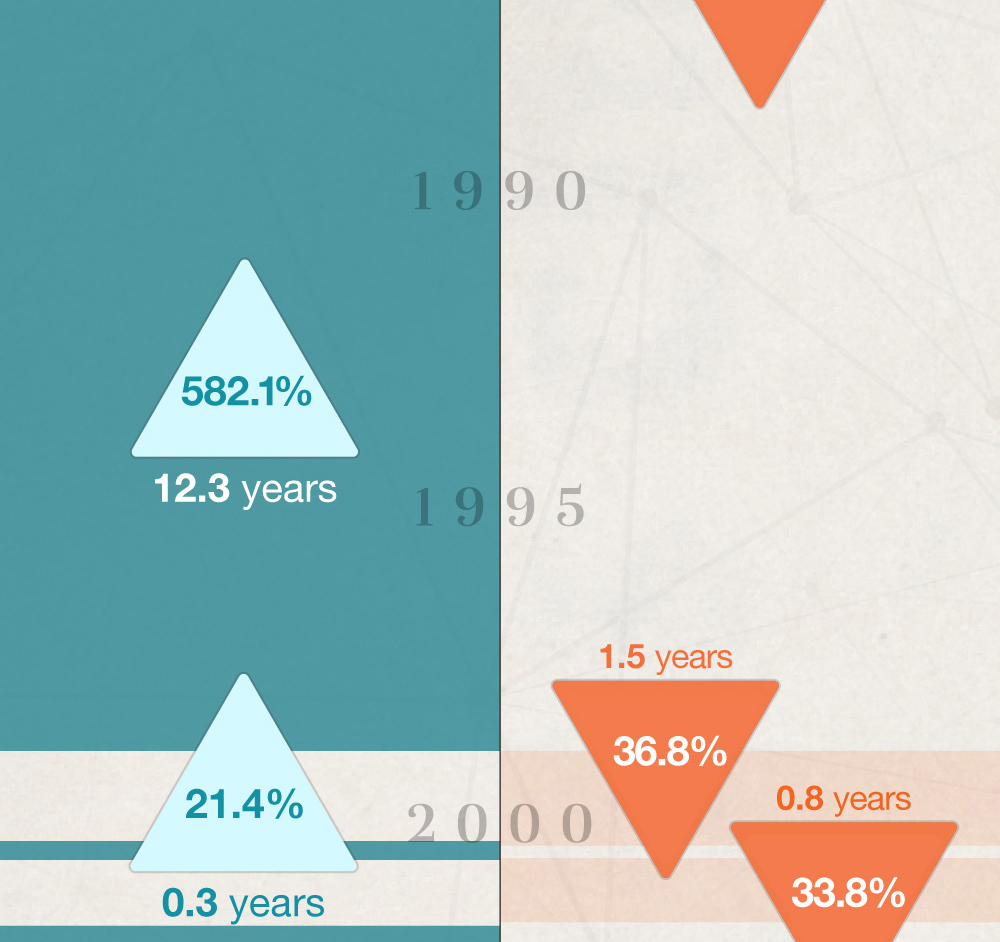
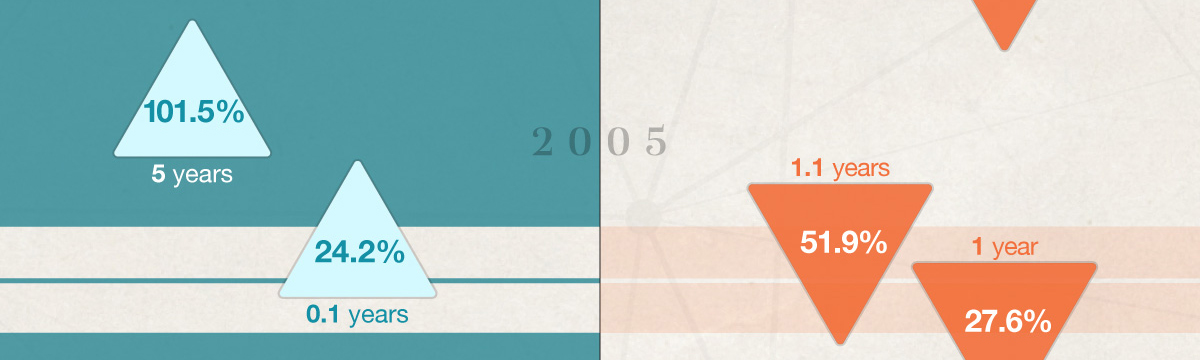
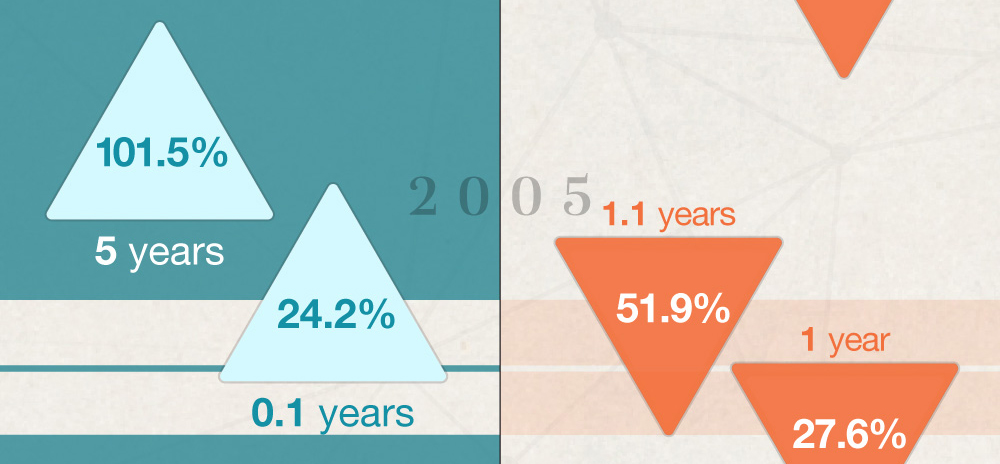
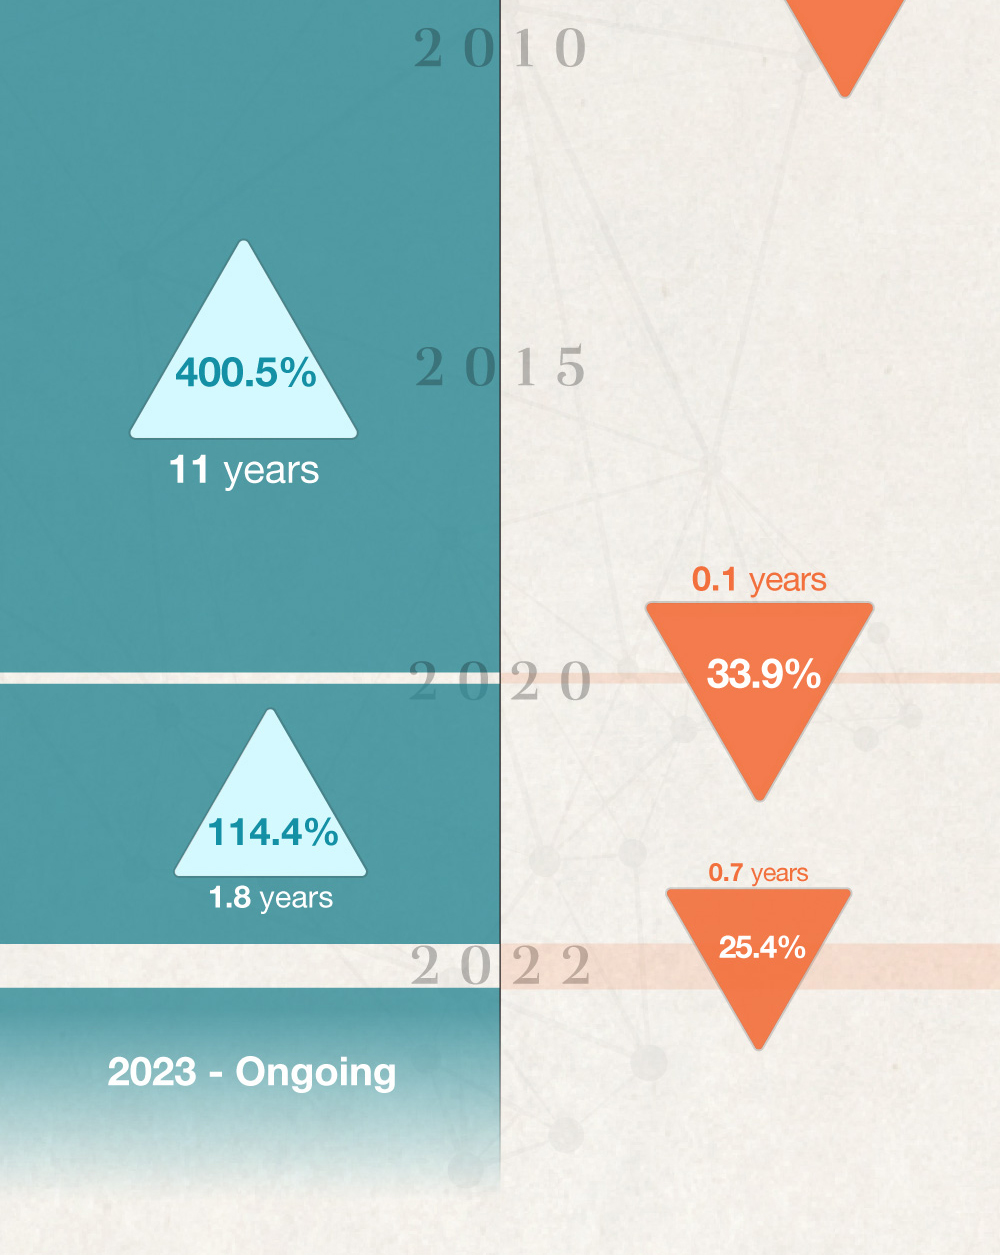
A look at how variable rates of return impact investors over time.

Impact Investing or Philanthropy

Impact Investing or Philanthropy

This fun piece can help your clients explore the benefits of impact investing versus founding a philanthropy.

Budget Check Up: Tax Time Is the Right Time

Budget Check Up: Tax Time Is the Right Time

Tax preparation may be the perfect time to give the household budget a check-up.


Have A Question About This Topic?


Thank you! Oops!

Is a SEP-IRA Right for Your Business?

For some, the idea of establishing a retirement strategy evokes worries about complicated reporting and administration.

Social Security Benefits: How Much Will I Receive

Calculating your potential Social Security benefit is a three-step process.

Buying vs. Leasing a Car

Whatever your relationship with your car, it may eventually come time for a new one. Familiarize yourself with your options.

View all articles

Bi-Weekly Payments

This calculator estimates the savings from paying a mortgage bi-weekly instead of monthly.

Federal Income Tax

Use this calculator to estimate your income tax liability along with average and marginal tax rates.

Home Mortgage Deduction

Use this calculator to assess the potential benefits of a home mortgage deduction.

View all calculators

Surprise! You’ve Got Money!

Here’s a quick guide to checking to see if you have unclaimed money.

The Cost of Procrastination

Procrastination can be costly. When you get a late start, it may be difficult to make up for lost time.

The Rule of 72

Do you know how long it may take for your investments to double in value? The Rule of 72 is a quick way to figure it out.

View all videos